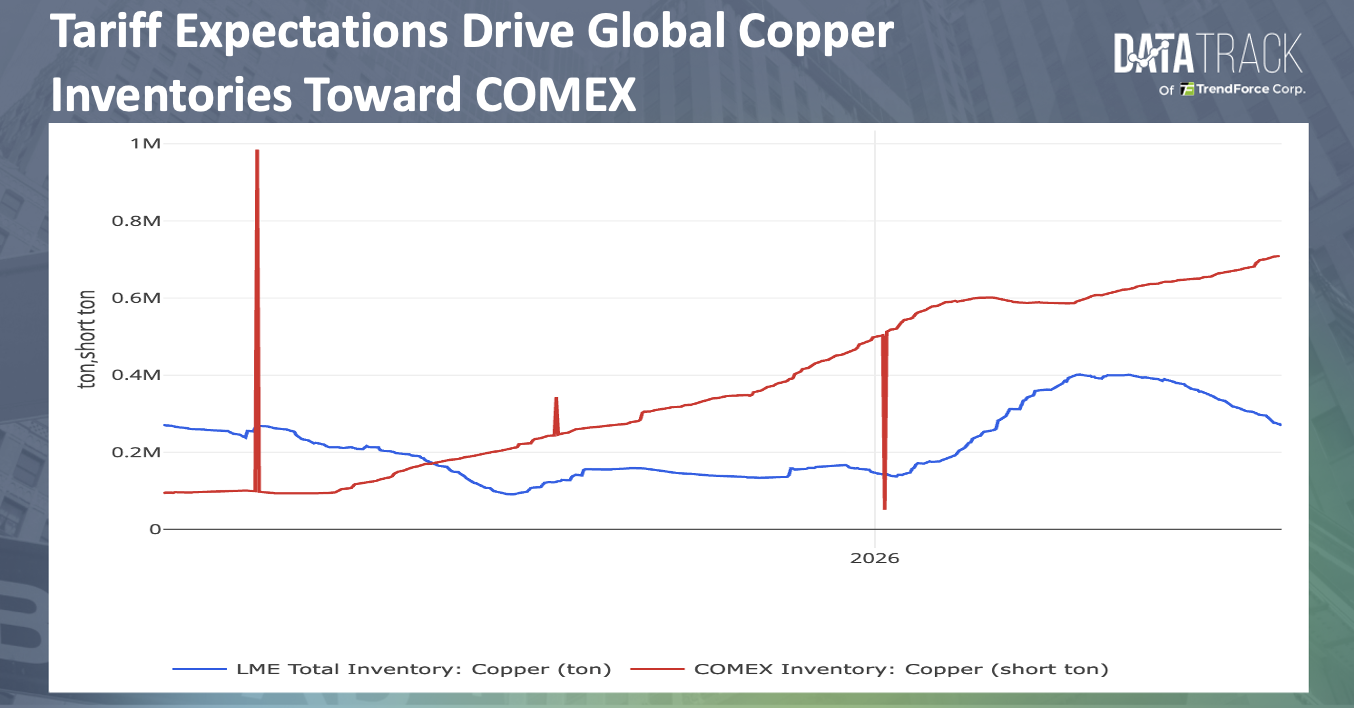
Although the United States has yet to finalize its policy on tariffs on refined copper, the global copper supply chain has already begun to adjust. Attracted by tariff expectations and the copper price premium in New York, refined copper has continued to flow into the United States, pushing up inventories at the Commodity Exchange, or COMEX. Inventories at the London Metal Exchange, or LME, and the Shanghai Futures Exchange, or SHFE, have declined simultaneously. After weak imports in the first quarter, China’s restocking demand recovered in the second quarter and in June, further tightening the availability of freely tradable physical copper in Asia and Europe.
The principal imbalance in the global copper market now lies in the geographic distribution of inventories. When U.S. prices exceed international prices, traders have an incentive to ship copper from Asia and Europe to the United States. This has gradually created a regional divergence characterized by rising inventories in the United States and tighter physical supply in non-U.S. markets.
Refined Copper Is Already Flowing into the United States Before Tariff Policy Is Finalized
The United States previously invoked Section 232 of the Trade Expansion Act of 1962 to impose tariffs on semi-finished copper products and certain copper-intensive derivative products, with rates varying by product category. Refined copper cathodes, copper ores, concentrates, and copper scrap were not included.
The U.S. Department of Commerce previously recommended imposing a 15% tariff on refined copper beginning in 2027 and raising the rate to 30% in 2028. However, the president must still decide whether to adopt the recommendation based on an updated market assessment submitted by the department. As of July 30, 2026, publicly available information did not indicate that the United States had announced a final tariff plan for refined copper.
Policy uncertainty has created opportunities to redirect physical copper across markets. When COMEX copper futures settlement prices exceed the closing price of LME three-month copper futures by enough to cover freight, insurance, financing, storage, and delivery costs, traders can purchase copper in Europe or Asia and ship it to the United States for sale or storage in COMEX warehouses.
In a report published on July 24, Morgan Stanley estimated that the United States had imported approximately 335,000 metric tons of copper ahead of potential tariffs since the beginning of 2026. Annualized at the pace prevailing at the time, this volume was equivalent to approximately 2.3% of global copper demand. An earlier estimate cited in a public report on June 8 placed the volume at 260,000 metric tons. The two figures reflect different measurement dates and indicate that copper inventories continued to move toward the United States under the influence of tariff expectations.
These figures represent Morgan Stanley’s estimate of accelerated imports and inventory transfers. They are not equivalent to official U.S. customs data on total refined copper imports.
Based on the July 22 figures from “COMEX Copper Futures Settlement Price” and “LME Three-Month Copper Futures Closing Price,” the converted New York–London price spread was approximately USD 507.70 per metric ton, equivalent to about 3.7% of the LME price. Because the two markets differ in contract maturity, quotation time, and delivery location, the spread should primarily be used to gauge the incentive for cross-market physical shipments. It should not be treated as a risk-free arbitrage return.
| Indicator |
Latest Market Signal |
Market Implication |
| Morgan Stanley's July 24 estimate of accelerated U.S. imports since the beginning of the year |
Approximately 335,000 metric tons |
Tariff expectations continue to attract copper into the United States |
| Converted spread between nearby COMEX copper and LME three-month copper on July 22 |
Approximately USD 507.70 per metric ton |
Cross-market shipping incentives remain in place |
| COMEX inventories in mid-July |
Approximately 625,000 metric tons |
Global visible inventories are becoming increasingly concentrated in the United States |
| Total LME inventories on July 20 |
Approximately 295,300 metric tons |
Down about 24% from the end of May |
| Share of cancelled LME warrants on July 20 |
Approximately 56% |
A large portion of inventories has been designated for withdrawal |
| SHFE inventories on July 29 |
Approximately 69,600 metric tons |
Inventories fell to a two-and-a-half-year low, reflecting continued depletion of available inventories in China |
| Yangshan copper import premium on July 17 |
USD 100 per metric ton |
The premium rose to a 14-month high, indicating a recovery in import demand |
Note: Publication dates and inventory methodologies vary across exchanges. The table uses the latest available figure for each indicator, with the applicable date shown separately.
Aggregate Inventories Remain High, but Tradable Physical Supply Outside the United States Is Tightening
As of the end of June 2026, combined copper inventories at the LME, COMEX, and SHFE totaled approximately 1.066 million metric tons, up 43% from the end of 2025 and the highest level since 2003. Based solely on the aggregate figure, the copper market might appear to retain an ample supply buffer. However, most of the increase has been concentrated in the United States, while European and Chinese markets have continued to draw down inventories.
The amount of copper actually available at the LME is also lower than the headline inventory figure suggests. On July 20, approximately 56% of LME copper inventories had been converted into cancelled warrants, indicating that holders had instructed warehouses to prepare the metal for withdrawal.
Cancelled warrants do not mean that the metal has already left the warehouse, nor do they necessarily indicate an increase in end-user consumption. However, this inventory can no longer be regarded as freely available metal that is immediately accessible for delivery. Tightening supply for nearby delivery also pushed LME spot copper above the three-month futures price for the first time since January 2026, creating backwardation.
This indicates that buyers are willing to pay more to secure immediate supply. The location of inventories and the status of warehouse warrants have therefore become more informative indicators of short-term market conditions than the aggregate level of global inventories.
Accelerated U.S. Imports and Chinese Restocking Are Competing for Physical Copper
A distinctive feature of the copper market in 2026 is that the United States has been accumulating inventories in anticipation of potential tariffs, while China resumed purchases in the second quarter following weak imports in the first quarter. The two markets have therefore begun competing simultaneously for limited physical supply.
China imported approximately 1.41 million metric tons of refined copper in the first half of the year, down 14.3% from the same period a year earlier, indicating that cumulative imports remained below the previous year’s level. However, second-quarter imports increased 42% from the first quarter and were 3% higher than a year earlier. Imports reached 281,307 metric tons in June, up 0.5% from the previous month and the highest level since September 2025, indicating that Chinese import demand had recovered from its first-quarter low.
Available inventories in China continued to decline during the same period. SHFE copper inventories fell to approximately 69,600 metric tons by July 29, their lowest level in two and a half years. The Yangshan copper import premium also rose to USD 100 per metric ton on July 17, reaching a 14-month high. Declining inventories, rising imports, and a higher import premium collectively indicate that China continued to require imported physical copper despite elevated prices.
In the near term, Chinese import demand has been supported by maintenance at domestic smelters, limited substitution from copper scrap, and restocking requirements. Over the medium and long term, investment in power grids, renewable energy, electric vehicles, and AI data centers continues to support end-user demand.
As U.S. importers accelerate purchases ahead of a possible tariff and China increases procurement, less refined copper is available to buyers elsewhere in Europe and Asia, further widening regional supply disparities across the global copper market.
Mine Supply Contraction and an Apparent Refined Copper Surplus Are Occurring Simultaneously
Data from the International Copper Study Group, or ICSG, show that global copper mine production declined 1.9% year over year to 9.38 million metric tons during the first five months of 2026, while copper concentrate production fell 3.4%.
Production declined significantly in Chile and Indonesia, while accidents and operational problems affected several large mines. These disruptions pushed global copper concentrate treatment charges to low levels, reflecting greater difficulty among smelters in securing feedstock.
During the same period, global refined copper production still increased by approximately 3% to 12.05 million metric tons, exceeding apparent consumption of 11.83 million metric tons and producing an apparent surplus of approximately 220,000 metric tons. The main drivers were higher refined copper production in China and the Democratic Republic of the Congo, together with growth in secondary refined output from copper scrap.
However, an apparent statistical surplus does not mean that every region has access to sufficient physical supply. Some of the additional metal has already been shipped into U.S. warehouses, while other inventories are constrained by location, warrant status, deliverable specifications, and logistics. As a result, a modest global statistical surplus in refined copper can coexist with tight physical conditions in Europe and Asia.
Regional Price Spreads Are Changing Trade Flows and Industrial Costs
Regional price spreads are first changing the direction of copper trade. As long as the U.S. premium is sufficient to cover transportation and financing costs, refined copper produced in Chile, Peru, Canada, and other locations is more likely to be shipped preferentially to the United States. Buyers in Europe and Asia seeking to retain supply may therefore need to pay higher physical premiums, sign longer-term procurement contracts, or maintain larger safety inventories.
Rising U.S. inventories also do not mean that domestic supply capacity has materially improved. Imported copper can provide a short-term buffer, but it cannot rapidly expand mining and smelting capacity. Should a tariff on refined copper take effect, downstream industries—including wires and cables, power-grid equipment, automobiles, construction, electronics, and data centers—could face higher raw-material costs before additional domestic supply becomes available.
Inventory movements driven by policy expectations also carry the risk of reversal. In July 2025, the market widely anticipated that the United States would impose a 50% tariff on refined copper. However, the final measures covered only semi-finished copper products and certain copper-intensive derivative products, leaving refined copper outside the tariff scope. COMEX copper prices and the New York–London price spread subsequently fell sharply.
When inventory flows are driven primarily by policy expectations and cross-market price spreads, a policy outcome that falls short of market expectations can cause both trading positions and physical shipments to reverse rapidly.
The Tariff Decision Will Determine Whether Regional Divergence Persists
If the United States adopts the Commerce Department’s earlier recommendation to impose a 15% tariff on refined copper beginning in 2027, the COMEX premium over the LME could widen again, and traders may continue shipping copper into the United States before the tariff takes effect. Once the policy is implemented, inventories accumulated in advance could provide a temporary buffer, but higher import costs would still gradually be transmitted to downstream manufacturers.
If the United States abandons the refined copper tariff, the COMEX premium could narrow. Some inventories might be re-exported or remain in U.S. warehouses for an extended period, while physical supply pressure in Asia and Europe could ease.
If the decision continues to be delayed, traders will still have an incentive to retain inventories in the United States, and the global market will continue to incur additional storage, financing, and logistics costs.
Key indicators to monitor include the final U.S. tariff decision and implementation schedule, the COMEX–LME price spread, the share of cancelled LME warrants, SHFE inventories, the Yangshan copper premium, and copper concentrate treatment charges. Together, these indicators will determine whether tight physical conditions persist outside the United States and whether U.S. inventory accumulation can continue.
The central risk in the copper market now stems from a geographic mismatch between physical supply and end-user demand. Once regional price spreads begin determining where copper is shipped, tariffs affect not only prices but also the logistics, storage, pricing mechanisms, and supply security of the global metals market.