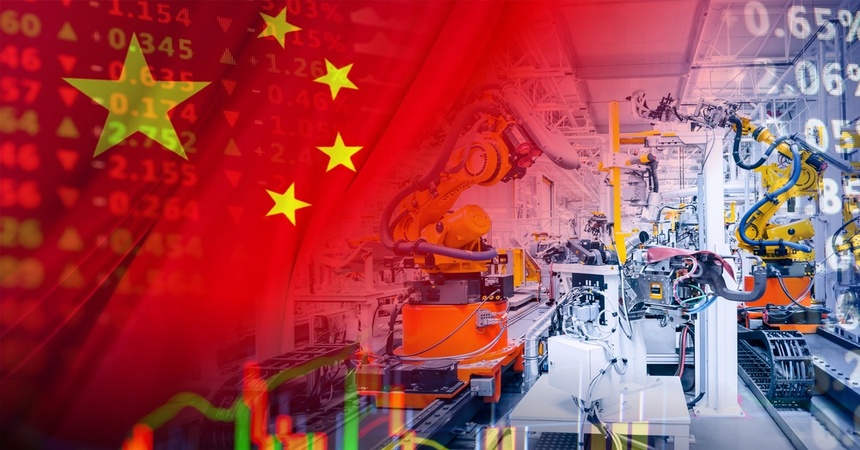
Global capital allocation logic is changing. Since 2026, international markets have been dominated by two major trading themes: first, AI capital expenditure driving technology stocks higher in the U.S., Taiwan, and South Korea; and second, the U.S.-Iran conflict and energy price volatility pushing war and inflation trades. As these two forces interact, investors have become significantly more sensitive to changes in high-valuation technology stocks, the U.S. dollar, U.S. Treasury yields, and oil prices. By contrast, Chinese assets have recently shown lower correlation with global AI trades and war trades, leading some international investors to view them again as an option for diversifying volatility.
The role of Chinese assets in global asset markets is shifting toward “low-correlation assets.” Market data on July 7 showed that the renminbi appreciated by about 5.4% against the U.S. dollar over the past year, while mainland Chinese blue-chip stocks rose nearly 11% in U.S. dollar terms in the first half of the year. Foreign holdings of A-shares also increased from RMB 3.67 trillion at the end of 2025 to more than RMB 4 trillion by the end of May. China’s bond market also remained relatively stable after tensions in the Middle East escalated. The 10-year Chinese government bond yield instead fell by nearly 10 basis points, contrasting with the rise in U.S. Treasury yields over the same period and highlighting its function in diversifying volatility.
Chinese assets have been able to remain relatively stable as global risks rise, while making the renminbi, Chinese government bonds, and some high-dividend assets relatively defensive, mainly due to three factors:
- China’s inflation cycle is not synchronized with that of Europe and the U.S., and its monetary policy is less affected by the Fed’s rate path.
- China’s market is still mainly priced by domestic capital and policy guidance, and is less directly affected by the global AI valuation cycle.
- China’s energy structure is less sensitive to oil price shocks than energy-importing countries such as Japan and South Korea. The government also has some ability to regulate refined oil prices, so the transmission of the U.S.-Iran conflict to China’s inflation and corporate costs is relatively contained.
Foreign capital inflows have also shown clearer sector preferences. In the first half of the year, South Korean investors bought about USD 2.819 billion in Chinese assets through individual stocks and ETFs, with A-share purchases increasing 130.55% year over year. Funds were concentrated in semiconductor equipment, AI chip, and new energy supply chain names such as Naura Technology, Cambricon, and CATL. This reflects that foreign investors are dividing Chinese assets into low-volatility positions such as renminbi bonds, high-dividend stocks, and large financial companies, as well as growth positions supported by policy, including semiconductors, domestic substitution, AI hardware, and new energy.
Changes in the structure of Chinese household assets provide another medium-term support line. Total Chinese household assets peaked in early 2023 and then declined for about six consecutive quarters, stabilizing in recent quarters at around RMB 730 trillion. More importantly, the composition of household assets has shifted away from heavy reliance on property and toward cash, deposits, and other financial assets. As of the first quarter of 2026, the share of real estate in household assets has significantly declined from the peak of the 2021 property market, while the proportions of cash, deposits, and other financial assets have risen in tandem. This indicates that household balance sheets are entering a phase of reducing real estate exposure and reallocating wealth into financial assets.
| Household Asset Category |
Share at the 2021 Property Market Peak |
Share in Q1 2026 |
Direction of Change |
| Property |
67% |
52% |
Down |
| Cash and deposits |
16% |
25% |
Up |
| Other financial assets |
15% |
20% |
Up |
*Note: Figures may not sum to 100% due to rounding and the exclusion of minor asset categories.
As real estate no longer serves as the main source of wealth appreciation, deposit funds in a low-rate environment may gradually seek alternative allocations such as stocks, funds, insurance, and wealth management products. However, this process is likely to be gradual rather than a short-term surge. Still, internal divergence in China’s economy remains clear. Technology and hardware supply chains are attracting capital, while consumption and real estate remain weak. As of July 8, the latest available official monthly data still point to this structural divide.
| Indicator |
Latest Change |
| May retail sales |
Down 0.6% YoY |
| Fixed asset investment from January to May |
Down 4.1% |
| Real estate investment from January to May |
Down 16.2% |
| May semiconductor output |
Up 23% YoY |
| May industrial robot output |
Up 28% YoY |
The data above show that China’s economy still presents a structure of “stronger manufacturing and technology, weaker domestic demand and real estate.” More timely indicators for June also suggest that manufacturing remains in expansion, but momentum has not accelerated across the board. China’s official manufacturing PMI rose from 50.0 in May to 50.3 in June, while the RatingDog manufacturing PMI edged down from 51.8 to 51.7, indicating that external demand and business confidence remain key areas to watch.
The banking system also faces issues such as increasingly bond-heavy asset allocation, net interest margin compression, and idle circulation of funds. If household and corporate credit demand remains weak for a prolonged period, the support from financial asset migration to the real economy will still be limited.
Looking ahead over the next few months, the core investment logic for Chinese assets will revolve around low correlation, policy stability, and asset reallocation demand. If global AI trades become more crowded and the U.S.-Iran situation continues to raise energy and inflation uncertainty, Chinese bonds, renminbi assets, and some policy-supported industries may still be included in global capital’s diversification allocation list. However, if Chinese consumption remains weak, downward pressure on real estate persists, or banking system risks increase, this “haven” positioning will also be tested.